AI Reporting: Marketing Dashboards That Explain Themselves
6 AI use cases for marketing reporting: From cross-channel reports to anomaly detection to predictive analytics. €44,500 net effect per year.
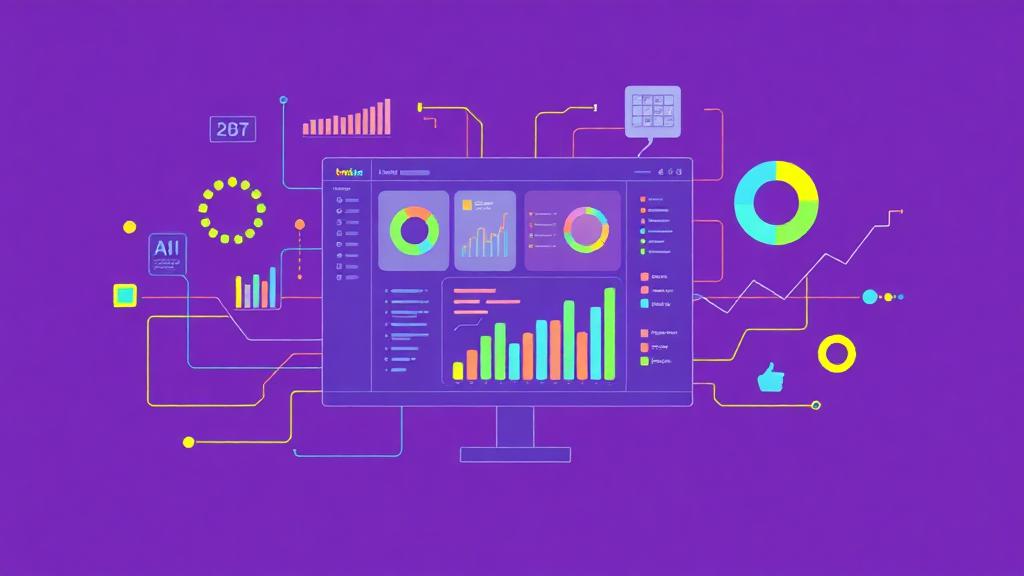
Table of Contents
AI Reporting: Marketing Dashboards That Explain Themselves
Marketing teams spend an average of 8 hours per week on reporting. Collecting data, formatting tables, creating charts, formulating insights. AI automates 80% of that – and delivers better insights than manual analysis.
The Problem with Traditional Reporting
| Problem | Impact |
|---|---|
| Data silos (GA4, CRM, Ads, Social) | No complete picture |
| Manual compilation | 8+ hrs/week |
| Past-focused | No forecasts |
| Dashboard overload | 50 metrics, 0 insights |
| Static reports | Outdated on delivery |
6 AI Use Cases for Marketing Reporting
1. Automated Cross-Channel Reports
AI connects all data sources and creates unified reports:
- Google Analytics, Meta Ads, Google Ads, LinkedIn, CRM
- Automatic data aggregation and cleaning
- Unified dashboard instead of 7 different logins
- Time saved: 6 hours per week
2. Natural Language Insights
Instead of interpreting numbers, AI makes data speak:
- "CPL on Meta increased 23% this week because audience overlap between Campaign A and B is at 45%"
- "Tuesday's newsletter performed 2x above average – question-format subject line was the driver"
- Result: Everyone on the team understands the data
3. Real-Time Anomaly Detection
AI spots deviations before they become problems:
- Traffic drop of 30%? Real-time alert
- CPC rising unusually? Automatic root cause analysis
- Conversion rate declining? AI checks technical and content factors
- Reaction time: Minutes instead of days
4. Predictive Analytics
AI forecasts future performance:
- "At current pace, you'll reach 87% of quarterly target"
- "Budget shift of 20% to LinkedIn would increase ROI by 15%"
- Seasonal trends and forecasts
- What-if scenarios: "What happens if we increase budget X?"
5. Automated Stakeholder Reports
Different reports for different audiences:
- C-Level: Executive summary, KPIs, ROI, trends (1 page)
- Team Lead: Channel performance, budgets, optimizations (3 pages)
- Specialist: Detail metrics, A/B tests, technical data (10+ pages)
- AI generates all three from the same data basis
6. Attribution & Customer Journey Analysis
AI solves the attribution problem:
- Multi-touch attribution across all channels
- Customer journey visualization
- Touchpoint evaluation: Which channel initiates, which converts?
- Result: Better budget allocation based on real impact
The Optimal AI Reporting Stack
| Tool | Function | From |
|---|---|---|
| Looker Studio + AI | Dashboards + natural language | Free |
| Databox | Cross-channel KPIs | $72/month |
| Supermetrics | Data connectors | €39/month |
| Narrative BI | AI-generated insights | $100/month |
| Whatagraph | Automated reports | €199/month |
| Power BI + Copilot | Enterprise analytics | €8.40/user |
ROI Calculation
| Item | Without AI | With AI |
|---|---|---|
| Reporting time/week | 8 hrs | 1.5 hrs |
| Annual personnel costs | €20,800 | €3,900 |
| Tool costs/year | €2,400 | €4,800 |
| Better budget allocation | – | +€30,000 value |
| Net effect | +€44,500/year |
Conclusion: From Data to Decisions
AI reporting doesn't mean more dashboards – it means better decisions. The focus shifts from "What happened?" to "What should we do?".
Start here:
- Connect all data sources in one tool
- Activate automated anomaly alerts
- Replace manual reports with AI-generated ones
- Implement predictive features step by step
Related Articles
You might also be interested in these posts
 Tools & Technology
AI Dashboards in Marketing: From Data Overload to Data-Driven Decisions
How AI Dashboards with NLQ, anomaly detection, and predictive analytics are revolutionizing marketing reporting – including tool comparison, KPI framework, and implementation plan.
 Tools & Technology
The New Model Generation July 2026: GPT-5.6 Sol vs. Claude Fable 5 & Opus 5 vs. Gemini 3.6 Flash
GPT-5.6 Sol, Terra and Luna, Claude Fable 5 and Opus 5, Gemini 3.6 Flash: pricing, context windows, benchmarks and a workable routing strategy for marketing teams – including migration after the Sora shutdown.
 Tools & Technology
Small Language Models & On-Device AI: The Cost Revolution in the Marketing Stack
Classification, routing, extraction: many marketing tasks need only a small model. Cost math against frontier models, cascading architecture, fine-tuning, and a realistic migration plan.