Performance Dashboard
Real-time data visualization with custom KPI tracking and automated reporting.
Get Started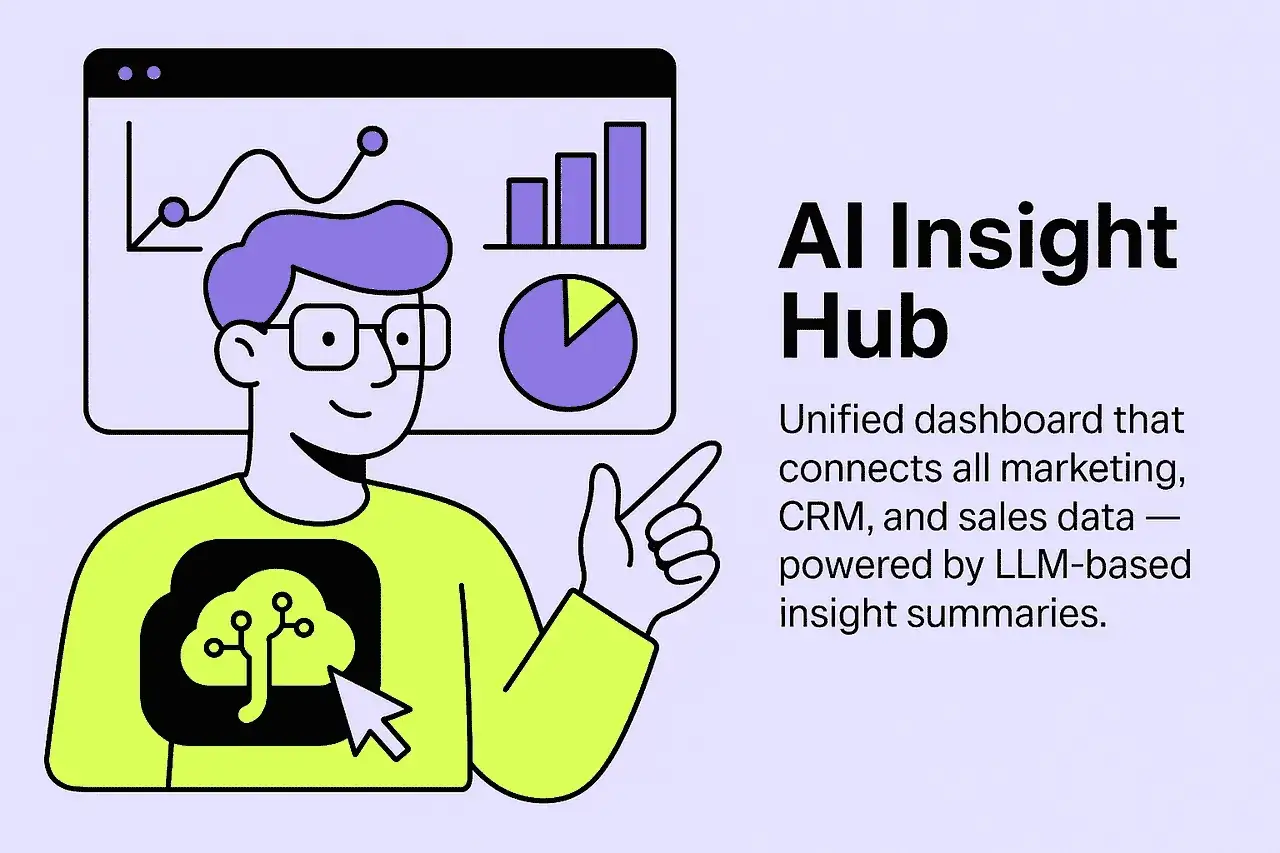
All Your Metrics, One View
See performance at a glance. Our Performance Dashboard consolidates data from all sources into customizable, real-time visualizations.
Key Capabilities
Real-time data visualization
Custom KPI tracking
Automated reporting
Cross-channel views
A dashboard that carries decisions
In short
Many dashboards show everything and answer nothing. A dashboard becomes useful only once it is clear which decision it supports and which metric drives that decision. Implementation therefore starts with that question, not with the choice of visualisation.
The build is layered: an overview with few lead metrics and a clear target-versus-actual statement, and underneath detail views by channel, campaign and period. Anyone who just needs status stays on top; anyone explaining a deviation drills down.
Metrics are defined once and calculated identically everywhere. Differences to platform figures — for example from different attribution windows — are shown rather than smoothed, so debates about numbers do not restart in every meeting.
Refresh time, data status and known gaps are visible. A dashboard whose freshness is unclear stops being used quickly.
How It Works
All metrics at a glance
Data Connection
Connect all relevant data sources.
KPI Definition
Select the most important metrics.
Dashboard Design
Intuitive visualization according to your wishes.
Automation
Regular updates and reports.
Business Impact
Monitor performance instantly
Make data-driven decisions
Share insights easily
Track progress consistently
What's Included
Your dashboard package
Real-Time Data
Always current metrics.
Custom KPIs
Your most important figures.
Cross-Channel View
All sources united.
Automatic Reports
Regular reports without effort.
Drill-Down
Call up details as needed.
Sharing
Easy sharing with stakeholders.
Frequently Asked Questions
Related Products
Discover more solutions in this area
Book your 30-min discovery call
Right in your Davies Meyer expert's calendar — pick an open slot that works for you.
Opens Microsoft Bookings in a new tab
By clicking, data is transferred to Microsoft (EU hosting via M365). See our privacy policy for details.